

What Probation Monitoring Dashboards Must Deliver
Probation officers supervise an average of 108 cases — more than double the 50-case maximum recommended by the American Probation and Parole Association. Without probation monitoring analytics systems that surface actionable information instead of raw data, officers spend their days triaging alerts instead of supervising people. The difference between effective and ineffective probation offender tracking dashboards comes down to three capabilities: real-time operational visibility, compliance scoring that prioritizes risk, and program-level outcome reporting that justifies budget decisions to county commissioners and grant funders.
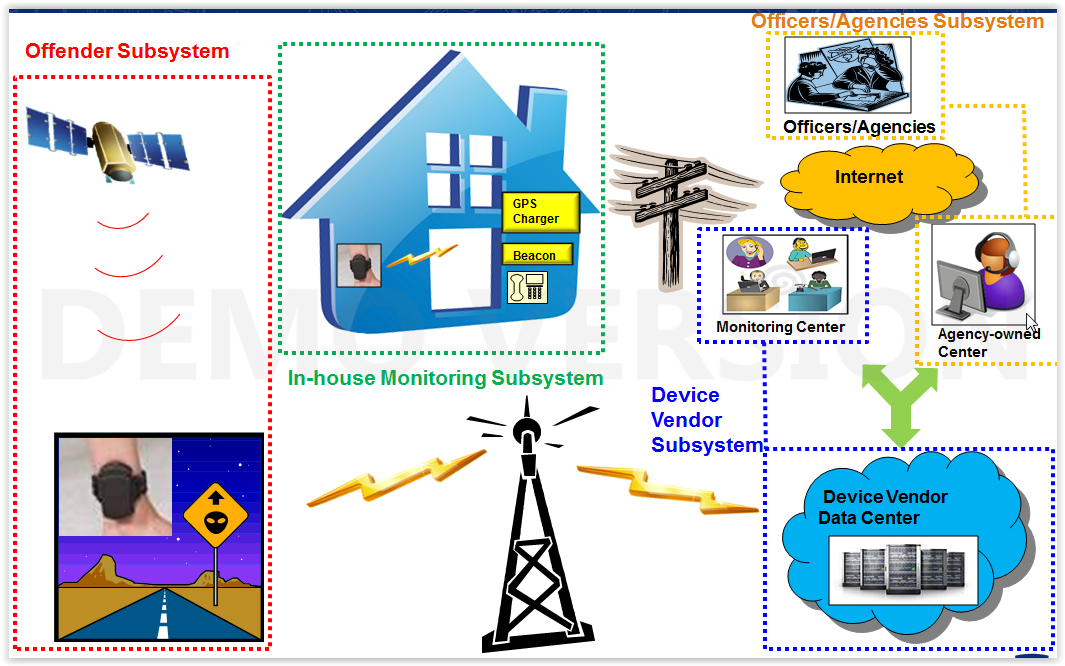
Because probation departments sit at the intersection of social services and public safety, the ankle monitor layer and the analytics layer must align. A GPS ankle bracelet that logs points without contextual rules forces officers to reverse-engineer violations manually — the opposite of electronic monitoring efficiency promises sold to county boards.
Why Must Probation GPS Dashboards Pair With Device-Quality Metrics?
Because dashboards only visualize what devices measure. Poor tamper discrimination or chronic indoor reporting gaps show up as ambiguous alerts that dashboards cannot fix with prettier charts.
Procurement teams should score both software UX and hardware telemetry: fix rate indoors, battery/charging adherence, and tamper-event reproducibility. Read one-piece vs two-piece GPS ankle monitors before assuming “GPS” implies identical field reliability. Product specs for CO-EYE ONE (108 g, LTE standalone up to 7 days, fiber tamper path) appear on CO-EYE ONE — use them as a benchmark when writing minimum acceptable performance for a GPS ankle bracelet RFP.
How Should Agencies Validate Probation Monitoring Analytics Before Award?
Demand a sandbox loaded with your historical alert volume, run blind scoring against known cases, and measure time-to-triage for high-severity events. If the vendor cannot simulate your caseload, the pilot will discover gaps too late.
Include API export tests into your case management system and CJIS-aligned access reviews in the same sprint — not as phase-two scope creep. For architecture and encryption expectations, pair this procurement with GPS ankle monitor architecture and security and the foundational GPS ankle monitor guide.
What Questions Close the Gap Between “Dashboard Demo” and Field Reality?
Ask how rules handle multi-path GPS errors, how charging noncompliance is distinguished from absconding, and how tamper alerts are adjudicated with evidentiary exports for violation hearings.
Vendor responses should reference officer workflows, not only screenshots. When programs charge user fees, also model how billing status appears to officers — financial stress drives ankle monitor charging failures that look like risk on a map. Our ankle monitor cost guide helps finance and supervision leadership align incentives.
Real-Time Probation Supervision Dashboards
A real-time probation monitoring dashboard answers one question at a glance: which cases require intervention now? Agencies managing 200+ active GPS cases can generate thousands of location points per day. Displaying every data point on a map produces visual noise, not insight.
Effective probation supervision analytics software applies rules to filter and prioritize:
- Alert severity tiers: Tamper events and exclusion zone violations surface immediately; low-battery and GPS-coverage gaps queue for batch review
- Caseload status indicators: Green/yellow/red per probationer based on the past 24 hours of compliance, not raw GPS pings
- Geographic clustering: Identify when multiple supervised individuals cluster at the same location — a potential violation or social dynamic requiring follow-up
- Officer-specific views: Each probation officer sees only their assigned caseload, while supervisors see rollup views across teams
Germany’s monitoring programs averaged one false alarm every three days per offender. Without smart filtering, that translates to hundreds of daily alerts per 200-device program. Probation monitoring reporting dashboards that apply compliance logic reduce triage time by 40-60% when compared to raw-alert systems.
Compliance Scoring and Workload Metrics
Compliance scoring converts location history into a single number that officers and supervisors can act on. The methodology matters: a system that flags every 5-minute deviation from a zone boundary creates alert fatigue; one that applies statistical thresholds and grace periods surfaces genuine violations.
Probation monitoring analytics should track:
- Daily compliance percentage: Did the probationer meet curfew, stay within permitted zones, and avoid exclusion areas? One score per day per case
- Trend indicators: Is compliance declining over 7 or 14 days? Early warning allows intervention before a formal violation
- Charging compliance: What percentage of probationers maintain adequate device battery? Low charging compliance predicts device failure and missed reporting
- Officer workload metrics: Average alerts per officer per day, average response time to high-severity alerts, caseload distribution. These metrics identify burnout risk and staffing gaps before they become crises
England and Wales report that RF electronic monitoring increased probation requirement completion from 54% to 65%. That outcome depends on officers knowing which cases need attention. Compliance scoring surfaces the 20% of cases that drive 80% of violations.
Program Outcome Reporting
County corrections directors and probation chiefs answer to commissioners, courts, and grant agencies. Program outcome reports answer: is this program working? Budget justifications require:
- Completion rate: What percentage of probationers complete monitoring without premature termination?
- Technical vs. substantive violations: How many terminations stem from charging non-compliance or minor zone deviations versus new arrests or absconding?
- Recidivism during monitoring: Washington DC’s program reduced new arrests by 24%. Your jurisdiction needs comparable data
- Cost per supervised day: Washington DC documented approximately $750 per participant per year (~$2.05/day). Benchmarks enable comparison against incarceration costs ($85-115/day per diem)
Without baseline data captured before program launch, outcome reports lack context. Professional probation monitoring dashboards should support export for audit purposes and integration with case management systems for longitudinal analysis.
Hardware Selection Still Drives Dashboard Signal Quality
No analytics engine can infer true compliance from a GPS ankle bracelet that chronically drops indoor fixes or misclassifies charging noncompliance as flight. When agencies split RFPs between “devices” and “software,” ensure joint acceptance testing: the same synthetic violation scripts must run end-to-end through the strap, the modem, the vendor cloud, and the officer console. Reference CO-EYE ONE published specs (108 g, LTE standalone up to 7 days, fiber tamper path, IP68) as one example of thresholds you can adapt into vendor-neutral minimums.
Probation chiefs should also score spares management and hot-swap logistics — dashboard green icons mean little if mean time to replace a failed ankle monitor exceeds 48 hours because inventory was under-procured. Electronic monitoring contracts that cap annual device replacements create perverse incentives for officers to tolerate flaky hardware.
Field Operations: Charging Support and Alert Fatigue
Dashboards should surface charging compliance separately from location compliance so supervisors can dispatch field support before low-battery conditions mimic absconding. Programs that assign unfiltered “GPS gap” alerts to line officers see higher turnover; use the dashboard to implement tiered response SLAs documented in union agreements where applicable.
Integrate probation GPS metrics with workforce analytics: if average time-on-task for alert review exceeds your target, either your rules are miscalibrated or your GPS ankle bracelet population is carrying the wrong reporting interval for risk tier. NIJ’s offender-tracking literature repeatedly stresses subsystem tuning — not raw point collection — as the determinant of program credibility.
Finally, align dashboard procurement with grant reporting: many federal streams require disaggregated outcome metrics by race, gender, and risk tier. If your analytics product cannot ethically and lawfully support those cuts while preserving small-n confidentiality, your electronic monitoring program may lose funding even when supervision quality improves.
Selecting Probation Monitoring Analytics Software
When evaluating probation offender tracking dashboards and analytics platforms, request:
- Hands-on evaluation with realistic data: Canned dashboards hide latency, filtering limitations, and usability issues. Simulate your caseload size and alert volume
- Compliance scoring methodology documentation: How are scores calculated? What thresholds trigger alerts? Can you adjust for your population?
- Mobile access: Field officers need smartphone views — not full desktop functionality, but enough to check status and receive critical alerts during home visits
- Export and API capabilities: Can you extract compliance data for court reports, grant reporting, and CMS integration?
For a comprehensive framework on probation GPS monitoring technology selection, see our Probation GPS Monitoring Guide. The guide covers hardware specifications, software platform requirements, and vendor evaluation criteria.
Stakeholders new to supervision technology should read what is an ankle monitor and the public-facing explainer on GPS ankle bracelet standards — shared vocabulary prevents RFPs from specifying incompatible combinations of hardware tiers and dashboard rules.
Contracting officers should also verify training credits: dashboards that require SQL literacy will underperform in real probation agencies. Budget vendor-led academies for line staff and supervisors in the same fiscal window as go-live, not as a optional year-two line item.
Include accessibility and Section 508 conformance for color-blind officers reviewing heatmaps — small UX gaps become equity issues when violation hearings rely on screenshots attached to court filings.
What GPS Ankle Monitor Specifications Matter Most for Probation Programs?
The five most critical specifications for probation GPS ankle monitors are: battery life (minimum 48 hours, optimally 7+ days), tamper detection false-positive rate (below 5%), device weight (under 150g for enrollee compliance), waterproofing rating (IP67 minimum), and cellular connectivity type (LTE-M/NB-IoT for 5G compatibility).
Probation departments face unique equipment challenges compared to pretrial or parole programs. Caseloads are typically larger (300-500 enrollees per officer), supervision durations are longer (months to years rather than weeks), and budgets are more constrained. These operational realities make certain GPS ankle bracelet specifications disproportionately important:
Battery Life: Probation enrollees often have unstable housing situations, irregular schedules, and limited access to power outlets during work hours. Devices requiring daily charging generate constant low-battery alerts that overwhelm officers with large caseloads. The CO-EYE ONE GPS ankle monitor addresses this directly with 7-day LTE battery life, 3-week WiFi mode, and 180-day BLE connected mode — reducing charging-related alerts by approximately 85% compared to 24-48 hour devices.
Tamper Detection Reliability: False tamper alerts are the single largest driver of unnecessary officer workload in electronic monitoring programs. Traditional PPG and resistance-based sensors produce 15-30% false-positive rates, meaning probation officers with 400-person caseloads may process 60-120 false tamper alerts per week. Fiber-optic detection achieves zero false positives — a difference that directly translates to recovered officer capacity for meaningful supervision activities.
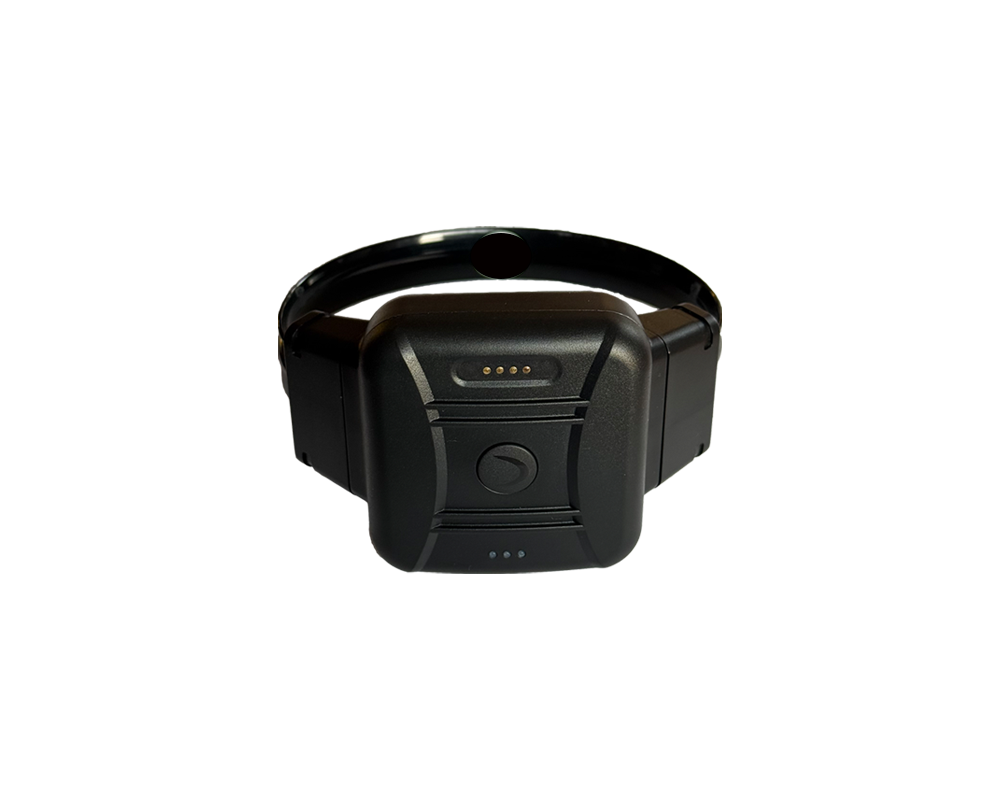
Device Weight and Comfort: Probation terms of 1-5 years mean enrollees wear the ankle monitor for extended periods. Lighter devices (under 120g) produce significantly higher long-term compliance rates because they create less skin irritation, are easier to conceal under clothing for employment, and generate fewer enrollee complaints that require officer attention. The industry’s lightest one-piece GPS ankle monitor currently weighs 108g.
How Should Probation Departments Structure GPS Equipment Procurement?
Probation departments should evaluate GPS ankle monitor vendors through a formal RFP process that weights total cost of ownership (30%), tamper detection reliability (25%), battery life (20%), software capabilities (15%), and vendor track record (10%) — rather than selecting based on lowest per-unit device price.
The most common procurement mistake in electronic monitoring is selecting the vendor with the lowest per-device price. A GPS ankle bracelet that costs 20% less per unit but generates five times more false alerts will cost significantly more over a three-year contract period when officer response time is factored in. The true cost of an ankle monitor program extends far beyond hardware acquisition.
Effective RFP evaluation frameworks for probation GPS monitoring should include:
- Live device testing: Request evaluation units from at least three vendors and conduct 30-day parallel testing with a small sample of enrollees. Measure actual battery performance, false-alarm rates, and officer feedback under real operational conditions.
- Reference checks: Contact agencies of similar size and population mix that have used each vendor’s equipment for at least 12 months. Ask specifically about false-alarm rates, vendor responsiveness, and hidden costs not covered in the contract.
- Three-year TCO modeling: Build a cost model that includes device purchase or lease, daily monitoring fees, cellular data, staff time for alert management, device replacement rates, training, and infrastructure (base stations, charging equipment). Compare vendors on this total rather than per-unit price.
- Technology roadmap: Evaluate each vendor’s investment in next-generation capabilities — multi-mode connectivity, 5G compatibility, AI-driven alert prioritization, and smartphone integration. Agencies locked into legacy 3G/4G-only devices face forced equipment replacement within 2-3 years as cellular networks evolve.
For probation departments managing GPS ankle monitor programs exceeding 200 enrollees, the equipment selection decision directly impacts both operational efficiency and public safety outcomes for the duration of the contract — making thorough evaluation essential rather than optional.
Related Resources
- Probation GPS Monitoring: Complete Technology & Implementation Guide — pillar resource
- Probation Monitoring Software: Cloud Platforms, Reporting & Compliance — platform selection
- Measuring Success: Key Metrics for Electronic Monitoring Programs — metrics framework
- CO-EYE Monitoring Software — unified offender tracking platform