

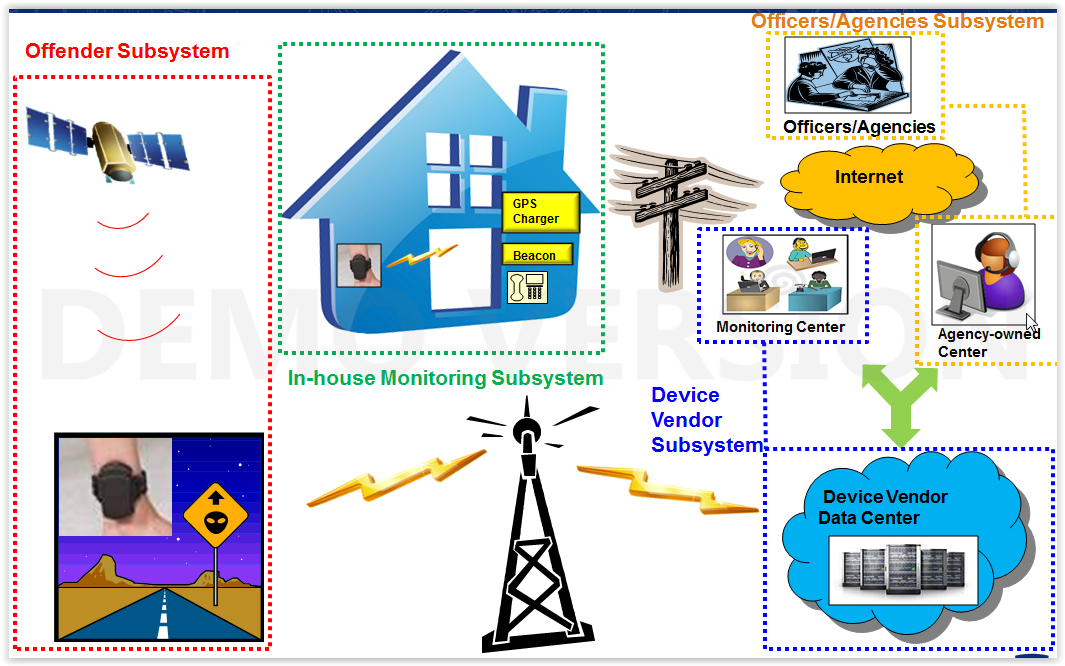
How Much Does an Ankle Monitoring Program Cost Per Day Per Offender?
GPS ankle monitoring costs government agencies between $5 and $15 per offender per day for a fully operational program, depending on technology tier, caseload size, and monitoring intensity. Washington DC’s program — one of the most rigorously cost-studied in the US — documented total annual costs of approximately $750 per participant, translating to roughly $2.05 per day. By comparison, pretrial detention costs range from $50,000 to $200,000 per inmate per year ($137-$550/day) depending on the jurisdiction and facility. Cook County found that EM saved approximately $8,200 per defendant compared to detention.
Why Cost Estimates Vary So Widely
Published cost figures for ankle monitoring programs range from $2 to $35 per day. This variation is not primarily about device prices — it reflects what each estimate includes or excludes. A vendor quoting “$5/day” may be citing only the device lease and platform fee. An agency reporting “$15/day” may include staff labor, overhead, vehicle costs, and false alert response. Neither number is wrong; they’re measuring different things.
For budgeting and legislative justification, agencies need the full loaded cost. For vendor comparison, the vendor-controllable portion (hardware, platform, cellular) is more useful. This article breaks down both.
Cost Component Breakdown
Vendor-Controllable Costs (What You Pay the Vendor)
| Component | Typical Range | Notes |
|---|---|---|
| GPS device (lease) | $2.50-$8.00/day | One-piece GPS devices cost more than two-piece; lease includes warranty |
| GPS device (purchase) | $800-$2,500 one-time | Amortized over 2-3 year lifespan = $1.10-$3.40/day |
| Monitoring platform fee | $1.00-$3.00/day | Software access, alert routing, reporting — sometimes bundled with lease |
| Cellular data | $0.50-$1.50/day | LTE-M/NB-IoT plans; may be included in platform fee |
| Strap replacements | $15-$60 per strap | Replaced every 2-4 months; optical fiber straps cost more but last longer |
| Spare inventory (10%) | 10% of device cost | Federal standard; needed for maintenance swaps and new enrollments |
Typical vendor total: $4.00-$12.00/day per offender
Agency Operational Costs (What You Pay Your Staff)
| Component | Typical Range | Notes |
|---|---|---|
| Monitoring center staff | $2.00-$5.00/day per offender | Based on 1 officer per 25-50 offenders at $45K-$65K salary + benefits |
| False alert response labor | $0.50-$4.00/day per offender | Highly variable — depends on tamper detection technology (optical fiber ≈ $0; PPG ≈ $2-4) |
| Field officer visits | $0.50-$2.00/day per offender | Periodic home visits, equipment checks, strap changes |
| Administrative overhead | $0.50-$1.50/day per offender | Court reports, compliance documentation, billing |
| Training (amortized) | $0.10-$0.30/day per offender | Initial and ongoing training costs spread across caseload and time |
Typical agency operational total: $3.60-$12.80/day per offender
Total Loaded Cost
Combined vendor + agency cost: $7.60-$24.80/day per offender
The wide range reflects the enormous impact of operational efficiency. A well-run program with optical fiber tamper detection, experienced staff, and a 50:1 offender-to-officer ratio operates at the low end. A program using high-false-alarm devices with a 25:1 ratio and frequent field visits operates at the high end.
The False Alert Tax: The Biggest Hidden Cost
False alerts are the single largest variable cost in most monitoring programs, yet they rarely appear in vendor proposals. Here’s the math for a 200-offender caseload:
| Scenario | False Alerts/Offender/Week | Total Weekly | Staff Hours/Week (at 20 min each) | Monthly Cost (at $30/hr) |
|---|---|---|---|---|
| Optical fiber tamper detection | ~0.5 | 100 | 33 | $4,000 |
| Fiber-optic strap (most vendors); metal wire clasp (SCRAM); electronic lock (Geosatis) | 3-5 | 600-1,000 | 200-333 | $24,000-$40,000 |
The difference — $20,000-$36,000 per month for a 200-offender program — exceeds the cost difference between premium and budget devices within the first quarter. Over a 3-year contract, a program that selected cheaper devices with high false alert rates may spend $720,000-$1,300,000 more on alert response labor than a program using optical fiber technology. This is why total cost of ownership — not per-unit price — should drive procurement decisions. Our vendor evaluation guide provides a framework for calculating these costs during the RFP process.
Cost Comparison: EM vs. Alternatives
| Supervision Method | Cost Per Day | Annual Cost | Source |
|---|---|---|---|
| Pretrial detention (jail) | $137-$550 | $50,000-$200,000 | Varies by jurisdiction; Urban Institute, Vera Institute data |
| GPS ankle monitoring (full program) | $8-$25 | $2,900-$9,100 | Range across US programs |
| GPS ankle monitoring (DC benchmark) | ~$2.05 | ~$750 | Urban Institute evaluation of DC program |
| RF home monitoring only | $3-$8 | $1,100-$2,900 | Lower technology cost; limited to curfew enforcement |
| Smartphone check-in app | $1-$3 | $365-$1,100 | Lowest cost; lowest supervision intensity |
| Unsupervised release | $0 | $0 | No direct cost but higher FTA rates; Cook County data shows EM reduced FTA by 10.6 points |
The DC study found that each EM participant generated approximately $580 in local government savings and $920 in federal savings compared to detention — a net positive return even before accounting for the societal benefit of $3,800 per participant from averted victimization.
Cost Optimization Strategies
Agencies operating within tight budgets can reduce per-day costs through several approaches:
- Tiered monitoring: Use GPS for high-risk offenders and smartphone apps for low-risk. San Francisco’s program expanded from 75 cases/year to 1,650 by deploying tiered technology matching risk level. A single vendor offering GPS ankle monitors, BLE wristbands, and smartphone tracking apps on one platform simplifies this approach.
- False alert reduction: Invest in optical fiber tamper detection upfront. The strap cost premium pays for itself within 2-3 months through reduced alert response labor.
- Offender-funded programs: Many jurisdictions require offenders to pay $5-$15/day as a condition of EM. Indigent offenders receive fee waivers. Revenue can offset 30-70% of program costs depending on payment compliance rates.
- Regional partnerships: Small counties can share a monitoring center with neighboring jurisdictions, spreading fixed staff costs across larger caseloads.
- Optimized caseload ratios: Targeting 40-50 offenders per monitoring officer (achievable with reliable technology) rather than the 25-30 ratio often seen in high-false-alert programs.
Budgeting for Legislative Approval
When presenting EM program costs to county commissioners or state legislators, frame the comparison against detention costs — this is the strongest justification. Use this formula:
Annual savings = (Average daily jail population diverted to EM) × (Jail per diem – EM per diem) × 365
Example: A county diverting 50 pretrial defendants from jail ($150/day) to EM ($15/day) saves:
50 × ($150 – $15) × 365 = $2,463,750 per year
Even at conservative estimates, EM programs typically demonstrate positive ROI within the first year. The Cook County study documented that EM also reduced failures to appear by 10.6 percentage points and new pretrial criminal cases by 7.4 percentage points compared to unconditional release — benefits that further reduce downstream justice system costs.
Related Resources
- County Corrections Electronic Monitoring Program Guide — comprehensive implementation planning
- How Electronic Monitoring Reduces Pretrial Detention Costs — detailed cost-benefit analysis
- How to Choose an Ankle Monitor Vendor — procurement evaluation framework
- Ankle Monitor RFP Specifications Guide